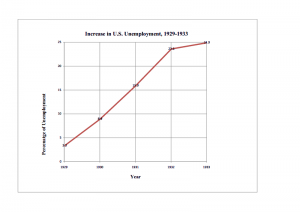
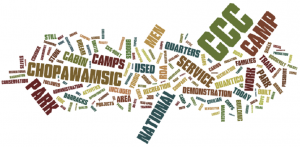
So I decided to make a better chart and a word cloud for a different text. I won’t be using the ones I previously posted in my website. I also made an infographic that I’ll bee using in my site, and a second interactive map. The former can be viewed here, and the latter can be found here.

