Plan for preserving my website and its content

There are several strategies that I will employ to preserve my website.  I’ll be using a fairly straightforward, generalized approach that can deal with each of the types of material on my website despite their variety, although some minor dissimilarities will exist between how I approach each of the individual materials just because of their disparate natures.

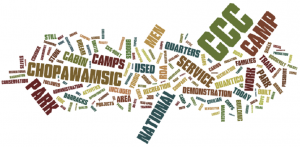
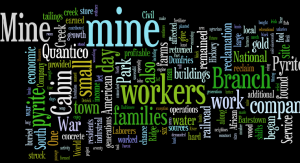
Text will be decently easy to preserve.  I already have it saved on my laptop and on a flash-drive, so if something happens to either, I’ll still have an available copy.  I’ll also e-mail the document to myself, and save the e-mail.  I can do the same with my line graph.  I already have it saved on my computer, and I’ll probably save it to a portable disk and e-mail it to myself and save it.  Since both my word cloud and my word tree are based on screenshots that I saved to my computer, I can use this approach to preserve them as well.

The interactive maps will be a little more difficult since they depend on a website for their survival.  Consequently, I can’t completely count on their being preserved indefinitely just because they’ve been saved on Google maps.  I could, however, save the text and pictures that are attached to each pushpin in the same way that I saved the text, etc. of my website; saving them to my computer, a portable disc of some kind, and by e-mailing them to myself.  Of course, there’s still the problem re-marking the various sites currently marked if something were to happen to either of the maps.  For this purpose, I’ll prepare detailed descriptions of each of the locations so they’re easy to find again.

The infographic will probably be the most difficult to preserve, since it depends entirely on a website.  If something happens to the website, it could obliterate the entire graphic.  I could take a screenshot of it and save that, but then I’d lose the interactivity which is integral to its value.  Alternatively, I could just save all the data along with a detailed description of the infographic, what it illustrated, how it was made, and all its elements.  That way, I can simply recreate it without any serious difficulty, if necessary.
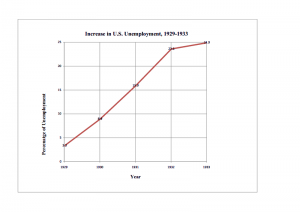
Chart for 18th and final project (word tree)

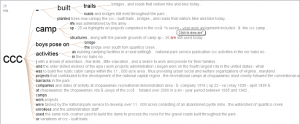
manyeyes word tree for HIST 390 final project

This is my word tree for my project and the assignment for the 18th.  It keeps coming up undersized for some reason, but it’s larger on my website.  I used it to illustrate the emphasis placed on the CCC’s role in the construction of Prince William Forest Park in one of my sources, which relates to my argument about the Great Depression and its relation to the construction of the park (more will be revealed in the actual site!).

Power point presentation

Power point for HIST 390

Here’s my power point presentation.   The sources I used correspond to those cited in the text for my final project that I’ve already posted.  The main difficulty I encountered was just that of balancing the competing demands of breadth versus depth.  I had to select material, and make an appraisal as to what should be included and what could be acceptably omitted.

Chart for June 13 and final project

Increase in Percent of US Unemployment, 1929-1933

Well, this chart took me an inordinate amount of time to complete, overall.  Although the particular chart I’ve posted only took about 20 minutes to make, the overall process took an extraordinary amount of time because I attempted to adjust the scale of the y-axis so I could have a chart with a maximum of 25 percent, where that was basically the highest value that’s actually part of my data.  Formatting it in that way would have provided emphasis on how drastic the increase of unemployment was–and emphasis that’s omitted in the completed form above.  Unfortunately, the map wizard program didn’t allow for such adjustments, so whenever I’d put the maximum number in, the the scale was still adjusted to 0-100.  Consequently, the line had the exact same placement on the graph, but the 25 was located where the 100 currently is.  If left this way, the map would misrepresent the data.  There also wasn’t an option of placing titles for the x and y axes, respectively, so clarify what they represent.  So I tried to make a title that’d make it as obvious as possible.

(I just realized that, for whatever reason, the chart doesn’t appear anymore once I’ve published it.  It can also be accessed here).

Map for June 12th and Final Project


View Cabin Camps in Prince William Forest Park in a larger map


For whatever reason, the google map I’ve created won’t appear in my blog.  Luckily, it can still be accessed through above link.  This is the map I’ve made for class for June 12th, and it’s also somewhat of a rough draft of one of the interactive maps I’ll be using in my final project.  It indicates the locations of the various Cabin Camps constructed by the CCC, and provides relevant historical information concerning the organizations that used them and how.  It provides insight into the transformation that the Forest Park region underwent after the institution of the RDA program and deployment of the CCC to perform the actual labor this program required.  It also illuminates some of the uses of the Cabin Camps.  Since these uses, the RDA program, and the founding of the CCC play such a central role in my historical argument, these details are particularly relevant and useful.

Evaluating my computer security practices

After reading the assigned material concerning online security and hacking, I realize that, although my internet security practices aren’t absolutely horrendous, they could certainly use some improvement.  I don’t have a password protected screensaver, and, although I tend to use passwords that are around 10 characters long and I avoid opening suspicious emails or attachments, my habits regarding password creation seem to fall under the dangerous trend that was described in Passwords Under Assault.  Namely, I have a nasty and perhaps irresponsible habit of reusing several passwords, and they tend to be created with the end in mind of being hard to guess and by incorporating a capital letter at the beginning and a number at the end.  To increase how secure my accounts are, I intend to broaden the range of passwords I use (better yet, I’ll use unique passwords for each account I make), and vary up my use of capital letters and numbers, using them in a variety of places in my passwords rather than just at the beginnings and ends of them.

Legality of the Internet Sourcebooks Project

The Internet History Sourcebooks Project constitutes an attempt to compile a plethora of online sources of a historical nature that can be used for educational and research purposes.  Most of the included sources are in the public domain, and those that aren’t are at least copy-permitted.  Now, insofar as  the sources included in these compilations are included in the public domain, there’s no real issue of copyright violation.  The legality of offering such sources to the public, then, is easily defensible.  Furthermore, since these sources are used for educational purposes (as opposed to commercial purposes), and since they’re of a factual nature, there’s reason so conclude that the Internet History Sourcebooks Project is protected under free use, and therefore doesn’t constitute any kind of copyright violation.